 Someone asked me an interesting question today: what percentage of Senators were born in the same state that they represent? The answer for the 112th Congress is 58%. That got me thinking about the question historically; what does the trend look like? It’s not obvious what the answer should be — you have the cross-cutting forces of 19th century western expansion (which presumably means lots of western Members who were born in the east) and much lower geographical mobility (which presumably means a much higher citizen population in each state that was born in the state).
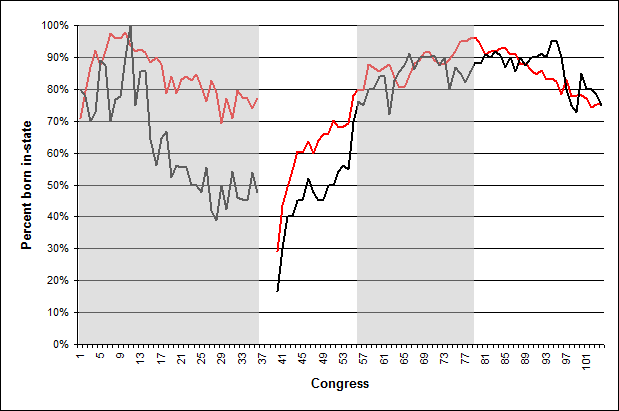
Anyway, I went and grabbed enough data to get a quick and dirty answer. The chart below plots the percentage of Representatives and Senators who were born in the same state they currently represent, from the 1st through the 104th Congress (I don’t have the more recent data handy).
1) The historical trends are probably due to expansion and mobility. The downward trend in the 19th century almost certainly reflects Representatives and Senators from new western states, where the percentage of people born out of state was extremely high for quite some time. The upward trend in the first half of the 20th century probably reflects the end of new state creation and the generational effect of more people being born in the western states. The downward trend after world war two is almost certainly due to increased geographic mobility, both because a greater number of people live in more than one state in their life, and also because this creates less voter attachment to “their” state. I’ve never seen any writing that posits a relationship between the fact that the early west was populated by non-westerners and the behavior of the Members such people elected, but the non-local roots of westerners certainly played a role in territorial politics, so I imagine there might be some fruit there for an enterprising scholar.
2) The gap between the Senate and the House. There are a bunch of theoretical stories that we can come up with to explain it. One is that Representatives have had, historically, a closer electoral relation to the people than Senators, and thus we might expect that the people prefer Representatives who are from their community. Another would be a 17th amendment story — that the state legislature tended to not care if someone was from the state, whereas the citizen population was more concerned with such factors and thus more often chose home-states. Both of these theories would explain the closing of the gap in the mid-20th century, as Senators were popularly elected beginning in 1914 (one cycle complete in 1918) and (in a not-unrelated development) began behaving more like Representatives in their constituent-relations activities.
3) The South. Using ICPSR definitions of the region (i.e confederacy minus Tennessee) and not counting the 37th-39th Congresses (1861-1867), here’s the chart:
Two things stand out, neither of which is particularly surprising. First, it appears that historically, a higher percentage of southern Representatives and Senators were born in-state. I suspect this is also true of the northeast, and confirms the hypothesis that western Members are the cause of the lower aggregate in-state numbers. Second point: the post-civil war carpetbagging is plain to see, and quite striking. Not until around the 51st-55th Congresses do the in-state Representative numbers return to pre-war levels. That was the 1890s!


